Add Datapoint Now
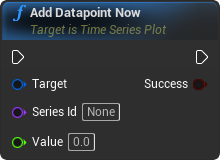
Add a datapoint using the current game time as the x-axis value.
Inputs
|
In
Exec
|
|
|
Target
Time Series Plot Reference
|
|
|
Series Id
Name
|
|
|
Value
Float
|
Outputs
|
Out
Exec
|
|
|
Success
Boolean
|